Bullish Reversal Patterns
Market Meditations | May 18, 2021
The Chart is a Battlefield
Let’s recall our battle analogy from Part 1:
- Candlestick charts show two armies waging war.
- The bodies of the white candles represent the bull army and the bodies of the purple candles represent the bear army.
- The chart represents the battlefield.
- Both armies are trying to get into each other’s territory.
- Wicks show failed attempts to get into army territory.
Remember, if you’d like for Koroush to guide you through this analogy on video, click this link.
Today, we are going to look at examples of Bullish Reversal Patterns. Or, in other words, situations where the bull army is getting ahead of the battle.
⛔️ Before we proceed, a word of caution. Candlestick patterns in isolation are not a buy or sell signal. Consider them a way to look at market structure and an indication of potential upcoming opportunities. And so, it is essential to look at patterns in context and combined with other tools such as Moving Averages, Fibonacci Retracement or Volume and Open Interest.
4 Bullish Reversal Patterns
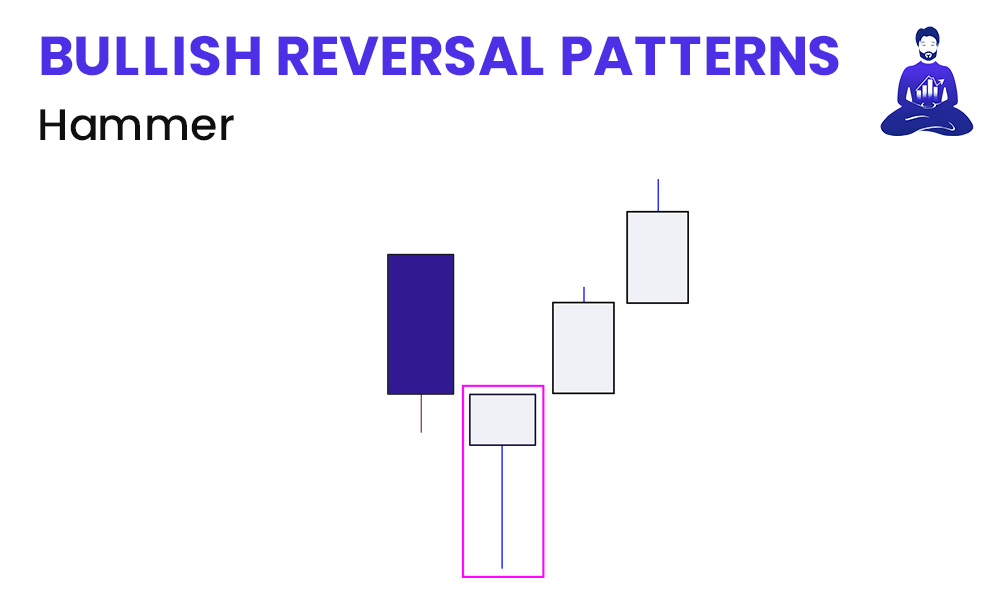
? HOW TO IDENTIFY A HAMMER: A candlestick with a long lower wick at the bottom of a downtrend, where the lower wick is at least twice the size of the body (if you don’t follow the terminology, you’ll need to return to Part 1 of our Course).
⚔️ WHAT IT MEANS IN BATTLE: A hammer shows strength from the bull army. The long wick indicates several defeated bears and is significant given the bears were winning the battle up until then. Note a white hammer indicates that the bull army is beating the bear army in battle. A purple hammer indicates the opposite, that the bear army is beating the bull army.
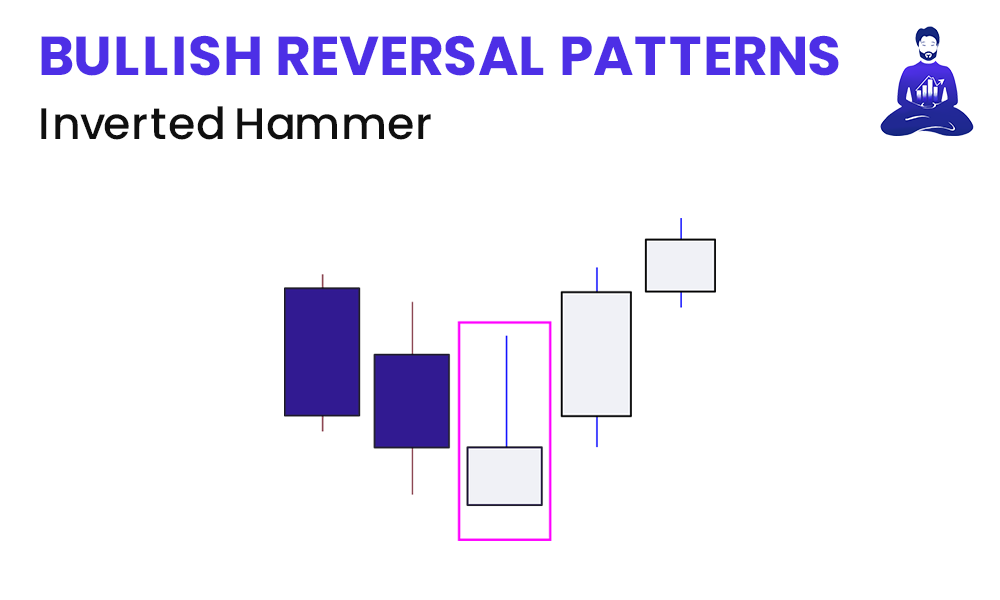
? HOW TO IDENTIFY AN INVERTED HAMMER: Also known as the inverse hammer. Scrolling up and comparing with the hammer: they are not so different, except the long wick is above the body rather than below. Same as the hammer, the upper wick should be at least twice the size of the body.
⚔️ WHAT IT MEANS IN BATTLE: An inverted hammer occurs at the bottom of a downtrend and may indicate a potential reversal upwards. In other words, the tides are turning in favour of the bull army. The upper wick shows that price stopped its continued downward movement, even though the seller eventually managed to drive it down near the open. The bullish army might soon gain control of the market.
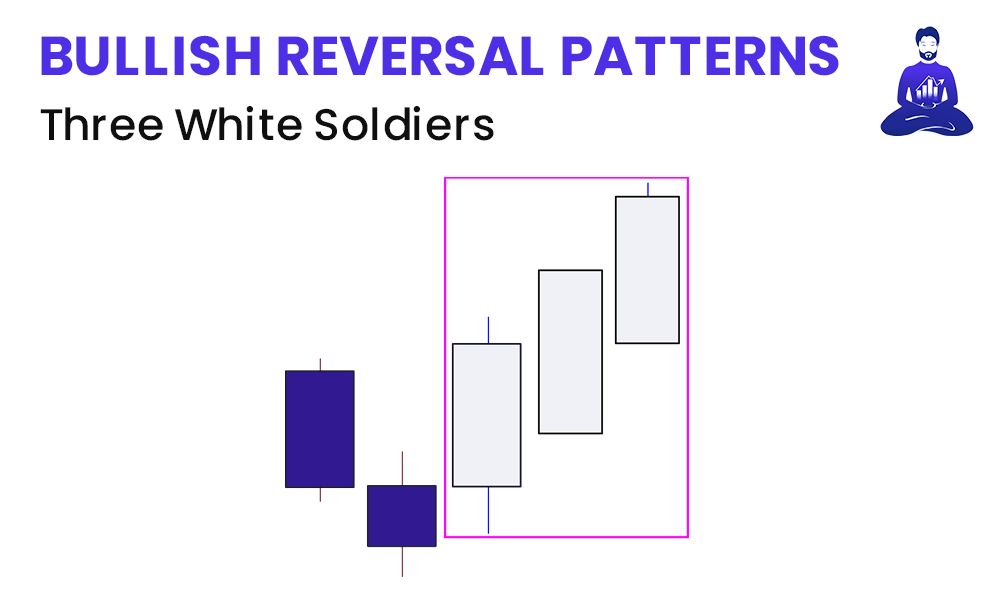
? HOW TO IDENTIFY THREE WHITE SOLDIERS: The three white soldiers are made of three consecutive white candlesticks that all open within the previous candle’s body and, importantly, close at a level exceeding the previous candle high.
⚔️ WHAT IT MEANS IN BATTLE: The soldiers are strong defenders of the bull army, working hard to create a possible retracement. The strongest soldiers won’t have long lower wicks, indicating that continuous buying pressure is driving the price up. For remember, wicks show failed attempts to get into enemy territory.
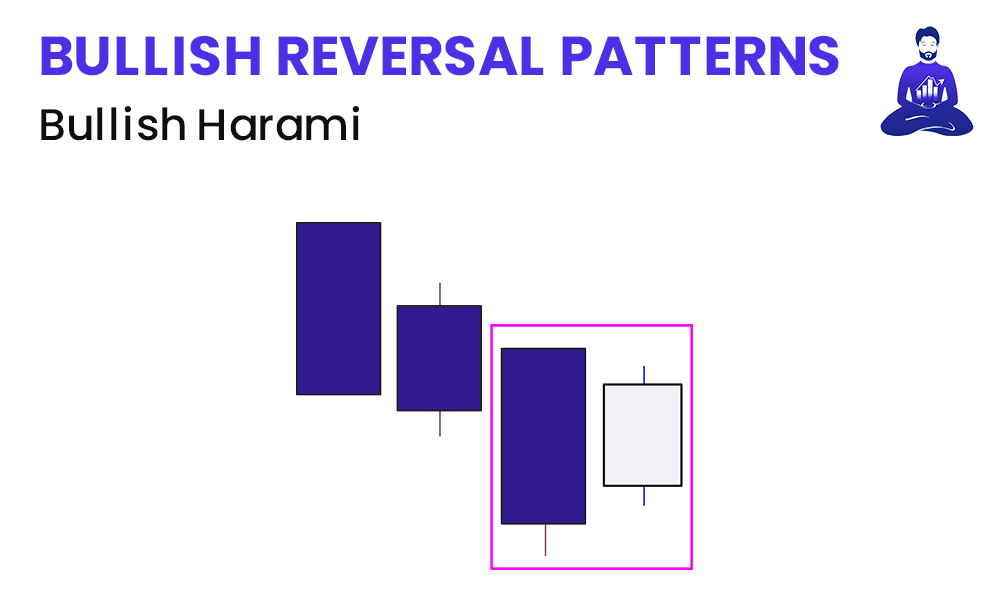
? HOW TO IDENTIFY A BULLISH HARAMI: A bullish harami is a long purple candle followed by a smaller white candle that’s contained within the body of the previous candle.
⚔️ WHAT IT MEANS IN BATTLE: An indication that the bearish army may be losing power. Selling momentum may be slowing down and might even be coming to an end. The bullish harami can unfold over two or more days.
Concluding Remarks
And thus concludes Part 2 on Candlestick Patterns Guide. This article should have provided a high level overview of Bullish Reversal Patterns and how to get started with interpreting them.
