Candlesticks 101
Market Meditations | May 17, 2021
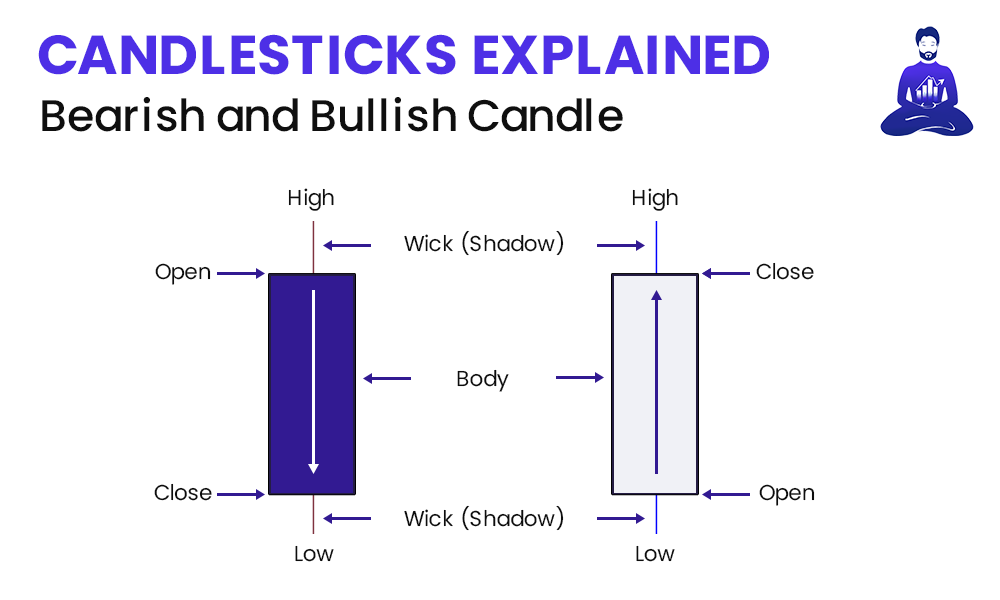
Let’s start with how to read candlestick charts as this forms the basis of technical analysis. Here are the components of a bullish or bearish candlestick you should be aware of
1️⃣ Body: the distance between the close and open price
- Colour A (Purple): Bearish candle where open price is higher than the close price
- Colour B (White): Bullish candle where open price is lower than the close price
2️⃣ Time: Each candle represents a specific interval of time (1M, 15M, 1H, 1D, 1W)
- Open and Close:
- Open: Price at the start of a time interval
- Close: Price at the end of a time interval
- Wick / Shadow
- These represent the highest and lowest price points reached during the time interval you are analysing
Here’s an example to clarify things:

Let’s say you’re analysing a candlestick on the 15 minute time frame. This means that there is exactly 15 minutes between the open price and the close price of the candle. Let’s say that at the start of this 15 minute candle, the price is $8. During this 15 minute interval, price goes from the $8 opening price as low as $5. It then moves up to a high of $13 before falling back down to $10, where it eventually closes. In this case:
Body ➡️ $2 | Time ➡️ 15 Minutes | Open ➡️ $8 | Close ➡️ $10 | Upper Wick ➡️ $13 | Lower Wick ➡️ $5
⏰ What’s the difference between different time frames?
- Higher time frames (e.g. 1 month, 1 week, 1 day): these time frames incorporate more data. This reduces variance and deviation from the mean, thus making higher time frame data more significant.
- Lower time frames (e.g. 1 hour, 15 minutes, 5 minutes): these time frames incorporate less data. They are more volatile and less significant to the bigger picture.
- More recent data is more significant / accurate: data from 1 year ago, for example, is going to be a lot more valuable than data from 10 years ago because what happened in the market 1 year ago is going to be more representative of the current market than what happened in the market 10 years ago.
? Visualization Technique
Now we understand the candles in isolation, we can begin to consider them in aggregate. That is, we can explore how candles come together to tell a story.
? Imagine there is a battle waging between buyers and sellers. There are two armies fighting this battle. The bodies of the white candles represent the bull army whereas the bodies of the purple candles represent the bear army. The chart represents the battlefield and who is currently winning the battle. Both armies are trying to get into each other’s territory. Check out our YouTube video where we elaborate on this analogy further.
In this analogy, large candle bodies represent the bull army taking control of the battle and invading bear territory. The wicks represent failed attempts to get into enemy territory, so when we see large wicks, that shows strength coming from the opposite side.
Many traders rely on memorising chart patterns such as ascending triangles and head and shoulders patterns or candlestick patterns like a bullish engulfing candle or pinbar candle.
? Thinking about the markets in terms of a battle between bulls and bears, however, helps understand the psychology behind why these patterns work in the first place. Understanding why candles form the way they form and patterns form the way they do is infinitely more important than memorisation.
A very simplistic approach is to consider whether a chart is ‘bullish’ or ‘bearish’. Instead, we always imagine there is a meter.
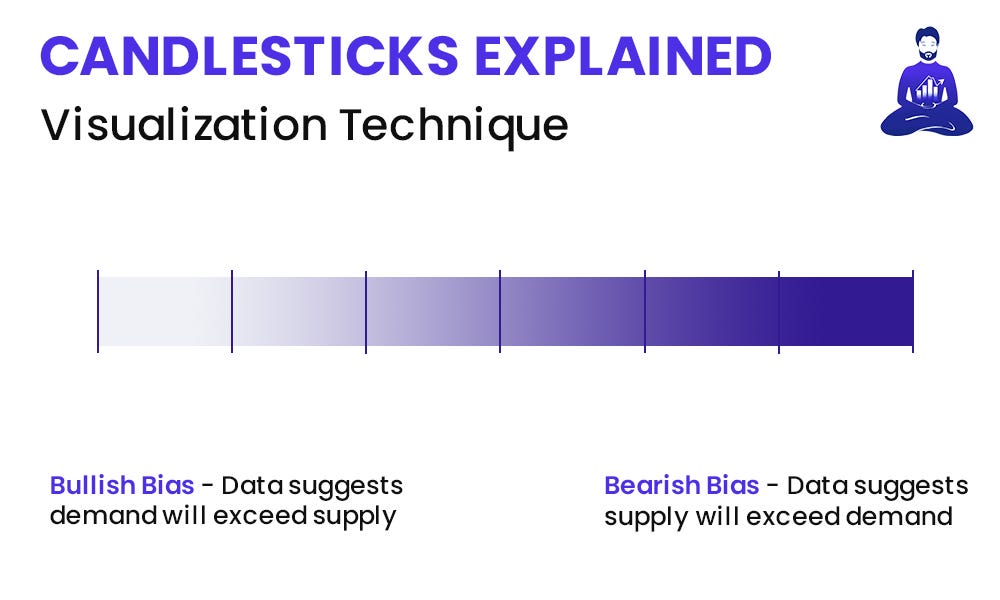
On one end of the meter we have a bullish bias which suggests that demand will exceed supply. On the other end of the meter we have a bearish bias, which suggests supply will exceed demand. We form a story on the basis of the extent to which the candles are bullish or bearish.
