Fibonacci Retracement
Market Meditations | May 12, 2021
Fibonacci Retracement: As Confusing As It Sounds?
Markets consist of supply and demand imbalances. There are certain prices where traders want to bid aggressively (known as demand zones) and certain prices where traders want to sell aggressively (known as supply zones). If you want an in-depth tutorial on supply and demand, check out our YouTube video here.
?Fibonacci levels are simply areas where price is likely to find an aggressive bidder (area of support) or aggressive seller (area of resistance).
It is not necessary to understand the way the Fibonacci retracement levels are calculated as trading software today will do this for you, but you should be aware of the most commonly used Fibonacci retracement levels among traders:
? 23.6%, 38.2%, 50%, 61.8%, and 78.6%.
The percentages mark our key levels price often retraces to after a move up or down. Where the move begins is known as the base. Where the move ends is known as the top.
For example, if price comes down to the 23.6% level after a move up from the base, that means it has retraced 23.6% from the top of the previous move. Let’s take a look at how to draw Fibonacci levels.
How to Draw Your Fibonacci Levels
? There is no right or wrong way to draw Fibonacci levels, If you decide to integrate Fibonacci levels into your trading system, however, make sure the method you use is consistent.
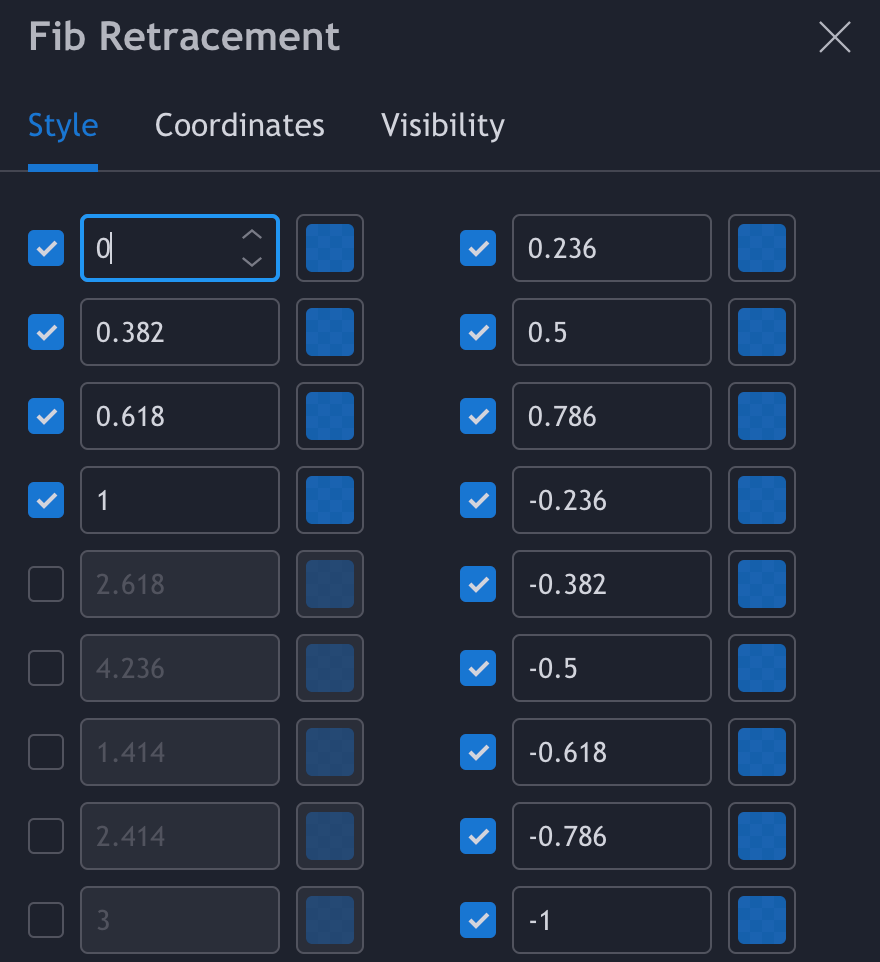
Otherwise, you’ll risk your past data not being helpful in the future. We’ve posted an image of the TradingView settings we use for Fibonacci retracement below. Check out our Beginner’s Guide to Trading Fibonacci Retracements & Extensions where we hold your hand through the setup process.
Here’s one method to consider when drawing Fibonacci levels ?
- Drawing Your Base: locate a candle body or wick where the trend began or at a lower low.
- Drawing Your Top: locate a candle body or wick where the trend ends or at a higher high.
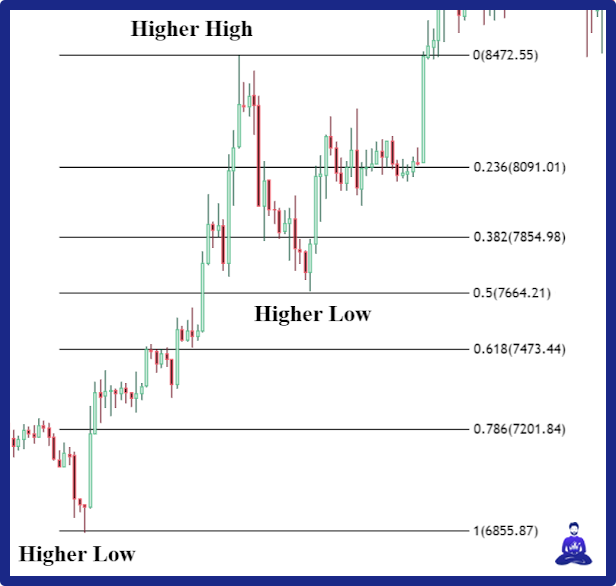
You can see in the example below that during this uptrend, we’ve chosen our base to be at $6855.87 and our top to be at $8472.55, the swing low and high of this move. Moreover, you can see that after the price hit a higher high, it retraced exactly 50% of the move, touching the 0.5 Fibonacci level to the dollar. Note, whilst we have provided an example in an uptrend, this tool works in a downtrend as well.
? Often, price will move upwards, pause by retracing a little bit, and then continue moving higher.
Is that technically considered a swing low? You may ask yourself, “how do you define a top in such cases where the price continues to move higherwithout any meaningful retracement?”
- Remember, there is no end all be all answer and the most important thing is finding a system that you use consistently.
- One strategy in these situations, however, is to trail the top until the move has retraced sufficiently.
- We consider a move that has touched the 0.382 Fibonacci level as “retraced sufficiently.” It’s not enough to move the swing low, in our trading system, if the price only retraces to the 0.236 level.
- So in a situation where the price moves up to $X, retraces to the 0.236, and then continues up to $Y, we would keep our original swing low as the base, but move our top from the original $X to $Y.
In other words, we keep moving the top up until price retraces to the 0.382 level. We’ve published a YouTube video wherein Koroush trails a top if you’d like to learn more.
Using Fibonacci Retracements in Your Trading
One of the most helpful functions of the Fibonacci tool is to aid in determining the strength of a trend. Put simply, the more the price retraces a move, the weaker the trend is. The less the price retraces a move, the stronger that trend is. Let’s define this more quantitatively.
Price retraces only to the 0.236 level ➡️ extreme strength.
Price retraces to the 0.382 level ➡️ high strength.
Price retraces to the 0.5 level ➡️ normal strength
Price retraces to the 0.618 level ➡️ below average strength
Price retraces to the 0.786 level ➡️ weak strength
? In addition to trend strength, you can utilise Fibonacci levels to find high probability areas for support and resistance. This is especially helpful when there is limited price action. In this regard, Fibonacci extensions can help you determine potential upside targets. For example, you might create a system in which you long the potential support of an extremely strong trend at the 0.236 level and sell when price creates a higher high at the -0.236 level.
When it comes to Fibonacci extensions, the stronger the trend the further you expect price to extend. Only by testing, however, can we get a better idea of the probability of each level of support and resistance holding. Check out our podcast episode to learn more about emerging crypto trends at a macro level.
Limitations
? Of course, there are also limitations to trading with Fibonacci levels. Just like any other indicator, they should be used as confluence to take on high probability trades, not as signals to enter and exit a trade. It’s also important to mention that proper risk management is paramount: just because you have a 0.382 level drawn on your chart does not mean price has to find support there.
Use indicators like Fibonacci levels as confluence with proper fundamental analysis, price action, and other indicators of your choice to take on high probability trades. In Part 1 of this 3 Part series, for example, we discussed Moving Averages. If you saw that a 0.382 retracement level lines up perfectly with the 4H SMA, for example, this can be a high probability long if you’ve taken care of your risk management.
