Moving Averages
Market Meditations | May 10, 2021
A Moving Average (MA) smooths out price action by filtering out market noise and highlighting the direction of the trend. Formulaically it is as follows:
Simple Moving Average

? In other words: it is the sum of the last n close prices divided by n wherein n = the number of time periods. So, technically speaking, it is an arithmetic mean not just an “average”.
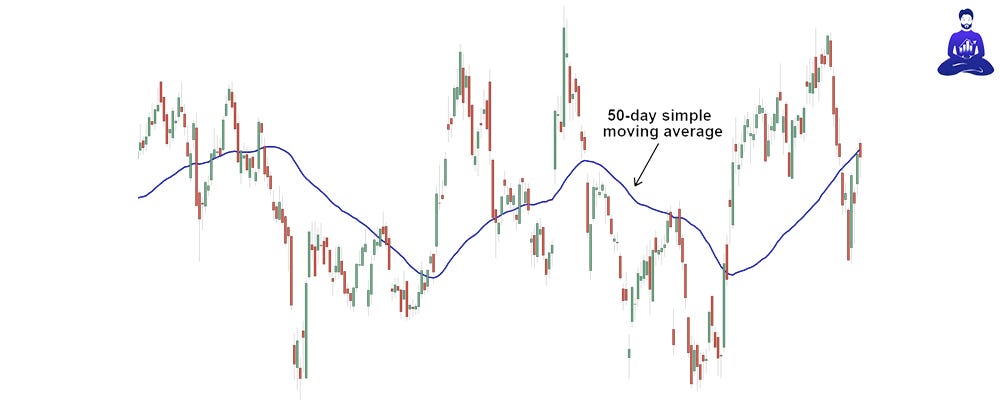
? Taking an example: the 50-day SMA is plotted by calculating the arithmetic mean over the last 50 days and the 5-day SMA would therefore be the arithmetic mean over the last 5 days.
Lagging Indicator
MAs are, importantly, a lagging indicator: they give us information about what has already happened. Thereby the timeframe you consider will come with a trade-off.
- 10-day SMA. A shorter time frame MA (smaller n), will be less significant (less data backing it and more volatile) but it will have less lag (the data will be more representative of the current market conditions).
- 100-day SMA. A longer time frame MA (larger n), will be more significant (more data backing it and less volatile) but it will have more lag (the data will be less representative of the current market conditions).
Why Are Arithmetic Means Useful?
✅ Eliminate data anomalies. If there are any data points that are extremely high or low, they will be drawn back towards the mean by other values which aren’t anomalies.
✅ They summarise data allowing for quick interpretation. They enable traders to make quick decisions based on larger trends.
✅ It gives an accurate representation of large bodies of data. By just looking at a chart, it’s difficult to see what the last 100 or 200 candles average out to, by getting the mean from the SMA we can very quickly get data over 200 candles.
Trend Analysis with Moving Averages
What’s important is the distance between moving averages:
1️⃣ The further apart MAs are: the stronger the trend. So, when moving averages go far apart, that means the trend is growing stronger.
2️⃣ Multiple crosses of all MAs in quick succession indicate no trend. Compared with the previous point, a cross of course means there is no distance between the MAs.
3️⃣ Crosses during a trend, indicate weakening of the trend. The idea here is that the short-term price movements aren’t following the longer term trend, suggesting the trend may be reversing.
Let’s take Friday’s Ethereum technical analysis as an example.

The line at the bottom will always be the higher time frame MA. So this has a very large n. The line at the top will be the short term moving average. Finally, the middle line conveys the medium term MA.
Notice the short term MA moves a lot more than the higher time frame. The higher time frame stays very consistent and true. It has not reacted as fast as the shorter time frame with regards to Ethereum’s price rally. Taking us back to our earlier point about lag.
We see a strong uptrend here using the checkpoints mentioned previously:
1️⃣ The further apart MAs are: the stronger the trend. We can see the beginnings of a strong divergence between the shorter and higher time frame MA lines.
2️⃣ Multiple crosses of all MAs in quick succession indicate no trend. No crossovers, with the shorter time frame comfortably above the higher time frames.
3️⃣ Crosses during a trend, indicate weakening of the trend. No crossovers but note the relative convergence of the lines before the big increase.
Getting Started
Most charting systems should allow you to select indicators and then to search for Moving Averages. Begin to apply them to the assets you trade and use our three checkpoints for trend analysis. If you are not currently set up on a charting system check out our Tradingview tutorial. The specific example used in our tutorial is Fibonacci EMAs. EMAs are Exponential Moving Averages. For EMAs, assume all the same rules as a regular moving average with 1 key difference: EMAs value recent data more than past data, so they are useful when you want to react strongly to more recent data.
Conclusion
And thus concludes Part 1 of our Technical Indicators Guide. This article should have provided a high level overview of MA and how to get started with using them. Remember, indicators are not the end of the story. You should have a range of tools in your toolbox that critically include Risk Management and Trading Psychology.
