Smart Money Guide
Market Meditations | November 3, 2021

First let’s consider who we will be targeting. This will be any “Smart Money” segments labelled on Nansen and this is made up of categories such as whales (wallets that are in the top 100 when sorted by balance of Eth) and funds (entities such as Alameda Research or Three Arrows Capital that invest in the space). A full list of these can be found here.
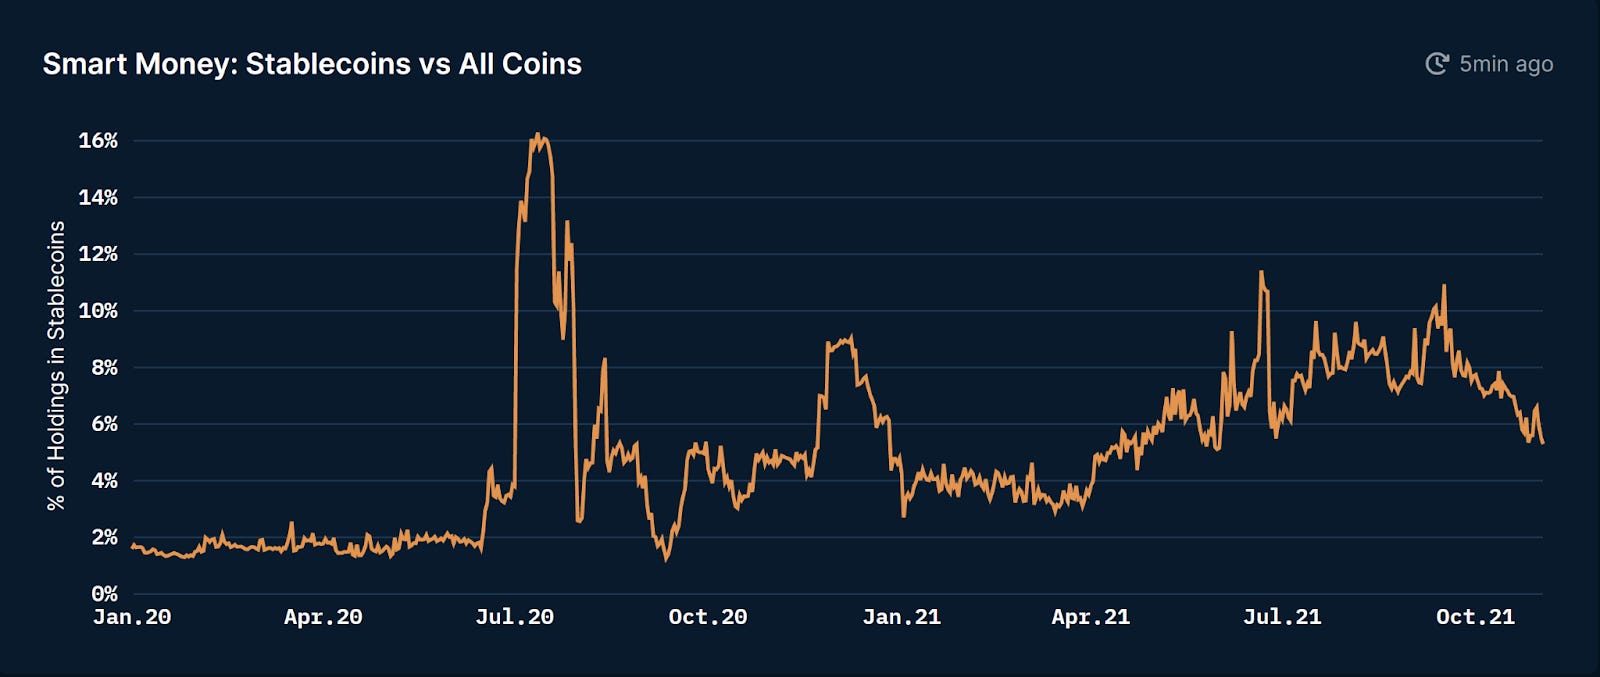
Now let’s dive into the insights themselves. Today we will look at the % of stablecoins that these smart money segments hold in their portfolios.
The lower the %, the more risk smart money is willing to take on and the more positive their sentiment towards price.
To find this information with Nansen, navigate to the Smart Money dashboard and click on the Token Holdings tab.
Nansen.ai: 03/11/2021
This chart reveals something interesting: currently the % of stablecoin exposure is on a downward trend, indicating that smart money is becoming increasingly risk-on.
As always we should question how valid our data is.
To do so, let’s look at historical information to understand whether this indicator could have helped us in the past:
- Starting on 15th July 2021, smart money started reducing risk significantly.
- Looking at BTC price data, this coincided with the first major bounce after the drop from previous all-time highs and this exact date reflected the highest BTC price for over 1.5 months.
- Similarly during the period of 13th July – 21st July, smart money started to increase their risk levels. This period represented levels close to the bottom, before an 80% price increase during the following month.
Whilst we should never rely on one indicator alone, the % of stablecoins held by smart money portfolios can be a fantastic data point to act as confluence with our systems. Using Nansen we are able to get this data and understand how much risk the biggest players in the space are willing to take on alongside their sentiment towards price.
