Tracking Whales
Market Meditations | November 24, 2021

Step 1: Asses the Macro Picture
We can use two primary pieces of data to gain macro insights into Smart Money. To find these navigate to the Nansen Smart Money dashboard and then to the Token Holdings tab.
% of Stablecoins Held in Smart Money Portfolios
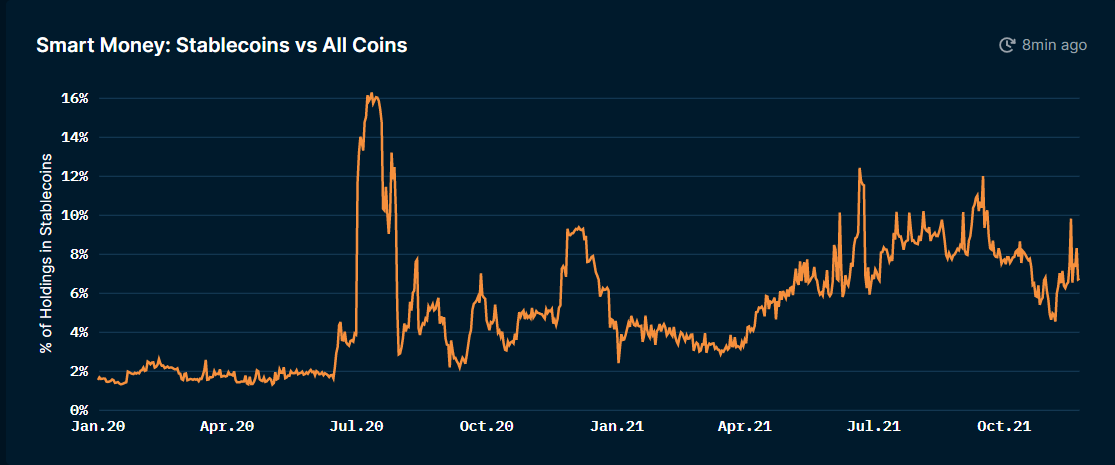
Nansen.ai: 24/11/2021 % of Stablecoins in Smart Money Portfolios
We can use this data to understand how much risk the smart money segment is willing to take and therefore their market sentiment. The higher the % of stablecoins, the lower the risk smart money is willing to incur.
- Currently, the proportion of stablecoins is starting a longer term uptrend, showing that smart money is starting to take less risk.
- However, we recently saw a sizable decrease. This indicates that they took recent price action as an opportunity to purchase more crypto assets.
Smart Money Token Holdings
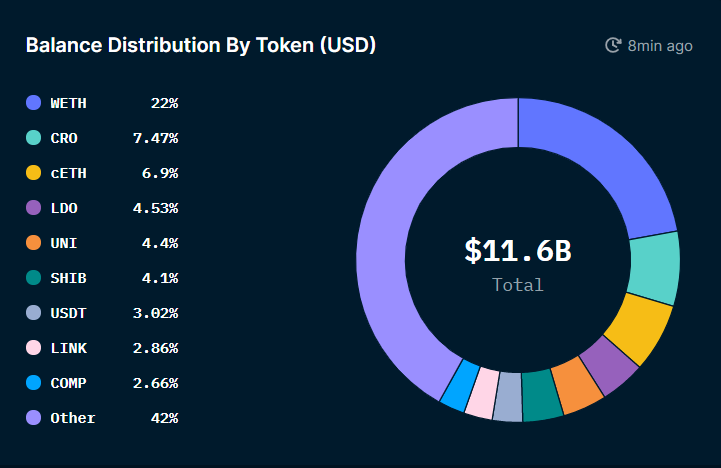
Nansen.ai: 24/11/2021 Smart Money Balance Distribution by Token
This chart shows us which coins make up the most of smart money portfolios.
- Wrapped Ether continues to dominate
- CRO (Crypto.com) holdings increase alongside it’s explosive price action
- Matic (Polygon) has fallen out of the top 10 coins showing that smart money interest in the layer 2 solution is starting to decrease
Step 2: Asses the Micro picture
Token inflows / outflows
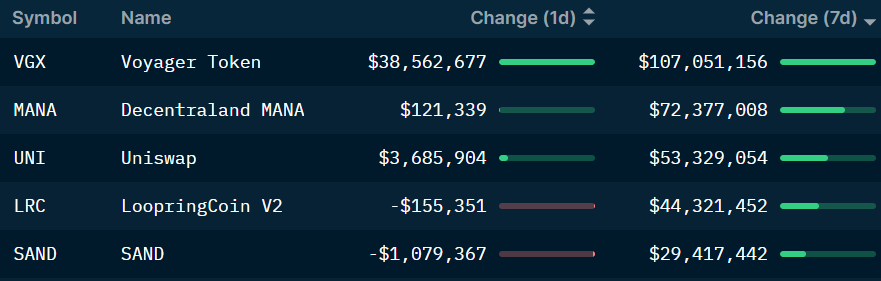
Nansen.ai: 24/11/2021 Smart Money Token Inflows
We can again find this data in the Token Holdings tab of the Smart Money Dashboard and shows flows of specific tokens into smart money wallets. This can be used to understand trending coins and wider narratives.
- Voyager has increased by over 50% this week due to its listing on coinbase. Following the smart money would have shown an increase in their holdings, before this announcement.
- Both MANA and SAND are projects related to the Metaverse. This is a trending narrative with MANA increasing by 60% in 7 days and SAND by over 100%. Again, following this data would have shown accumulation before these price movements.
Pro tip 1: Using the Token Flows feature found under the Diligence heading, Nansen can also filter for tokens created in any given time period. This allows us to see if there are new coins which the smart money segment is starting to accumulate.
Pro tip 2: We can use the Smart Money – Token Profiler feature (also found under the Diligence heading) to look at all smart money transactions and holders of a specific token.
Step 3: Finding Confluence
As with any indicator, smart money data cannot be used in isolation. Firstly, following a reliable news source is essential. This gives us an understanding of why certain token movements may be happening and can help us take advantage of the data.
We also need the skill to profit from markets. There are a huge number of elements to any successful trading system from technical analysis to psychology. To help we are releasing a free course that anyone can use to make money from crypto. Click here to check out the first episode.
Conclusion
Using Nansen we are able to understand the risk levels and trending narratives of those that have the most knowledge in crypto. Doing so allows us to profit from knowledge that the rest of the market does not have.
