Volume and Open Interest
Market Meditations | May 13, 2021

Let’s begin with some simple definitions and interpretations:
VOLUME
- Definition ➡ the total number of coins exchanged during a given period of time
- Interpretation ➡ a metric that shows total trading activity: how many trades have happened during a given period of time
OPEN INTEREST
- Definition ➡ the total number of outstanding longs or shorts in the market (aka total number of contracts)
- Interpretation ➡ a metric that shows whether money is actually flowing in or out of the market.
Now we have a vague understanding, we can put it together in a hypothetical scenario:

Phase 1: Koroush AK creates a contract to sell $ETH and Market Meditations buys that contract. Koroush AK has made a new contract and one trade has occurred. A trade has occurred because there was a buyer and seller of a contract. So in this instance both Open Interest and Volume go up by 1.
Phase 2: Market Meditations has made money off the $ETH bought from Koroush AK and decides it’s time to sell it to Koroush AK47. In this instance, no new contract has been made, so open interest stays the same but volume goes up by 1 again because a trade has been made. Why is open interest the same? Market Meditations has left the market and Koroush AK47 has joined the market, hence no new money has flown in. This is a crucial difference between Volume and Open Interest.
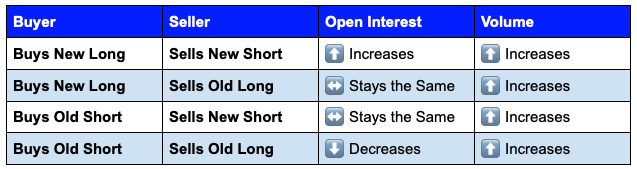
The below table considers all possible scenarios and the implications for Open Interest and Volume.
? Volume and Open Interest: Using them to Trade
FTX provides data on 24h Volume and Open Interest. Simply navigate to the contract you want to view and you will see the information on the right hand side of the screen. Continuing from the example above, we’ve taken a screenshot from FTX ETH-PERP at 14:20 BST.

Source: FTX
If you are trading an asset rather than a contract, you’ll still have 24h Volume but you won’t find data on Open Interest.
Volume and Open Interest applied to Trend Analysis:
UPTREND
1️⃣ Volume Increasing, Open Interest Increasing. Suppose we believe we are in an uptrend (price is forming higher highs and higher lows) and we can see that both Volume and Open Interest are increasing. Well, this means that the total trade activity is increasing and the number of participants in the market are increasing as well. In other words, there is an increase in both demand and interest in whatever asset is being traded. So, open interest and volume agree with our analysis that we are in an uptrend so the implication is that we have a strong uptrend.
2️⃣ Volume Decreasing, Open Interest Decreasing. Imagine the opposite is true. We believe we are in an uptrend but Volume and Open Interest are decreasing. So trading activity isn’t increasing despite the increase in price and new participants are not entering the market. The metrics disagree with our analysis and so the implication is that we have a weak uptrend. From this we might infer either that the price is going to reverse soon or it’s not going to move very far.
DOWNTREND
3️⃣ Volume Increasing, Open Interest Increasing. Now let’s suppose we believe we are in a downtrend (prices are forming lower highs and lower lows) and both Volume and Open Interest are increasing; the number of market participants are increasing and trading activity is confirming that we are in a strong downtrend.
4️⃣ Volume Decreasing, Open Interest Decreasing. Finally, if we are in a downtrend and Volume and Open Interest are decreasing, participants are leaving the market and therefore we are in a weak downtrend. We expect it to reverse quickly or not last a very long amount of time.
? Volume and Open Interest: Using them to Identify Liquidity
Now we know how to use Volume and Open Interest for trend analysis, let’s move on to using them to identify liquidity. Volume and Open Interest are useful tools for ensuring the market has enough liquidity to support our orders. It becomes very difficult to navigate the market when there’s no one to take the other side of your trades. Especifically when you start trading with larger position sizes.
This can be very useful when selecting from multiple similar behaving assets. For example, in the altcoin market where there are a lot of similarly behaving assets, determining liquidity is one of the best ways to choose which one to trade. Look for the high-volume pairs; the ones that have a lot of volume are easier to navigate and get large position sizes filled on. For a step by step guide on how to use liquidity to identify which altcoins to trade, we have the following resources: Find the Best Altcoins to Day Trade ? and Finding Gems ?
? Volume and Open Interest: Concluding Remarks
And thus concludes the final chapter of our 3 Part Technical Indicators course. Remember, take no single indicator in isolation. Consider the process whereby you make a trading decision or strategy a puzzle. Volume and Open Interest are but one piece of the puzzle. You’ll want to consider a range of other factors to complete the puzzle, including but not limited to: other technical indicators, risk management and trading psychology. All things we will be releasing future guides on.
